Facebook Insights: Do you Like Your Results? (The Sequel)
In part one of our insights on Facebook Insights, we gave you a high level look at the Overview tab which included the definitions of many key Facebook metrics. If you haven’t read that, go do that now. We’ll wait.
The “Likes” tab
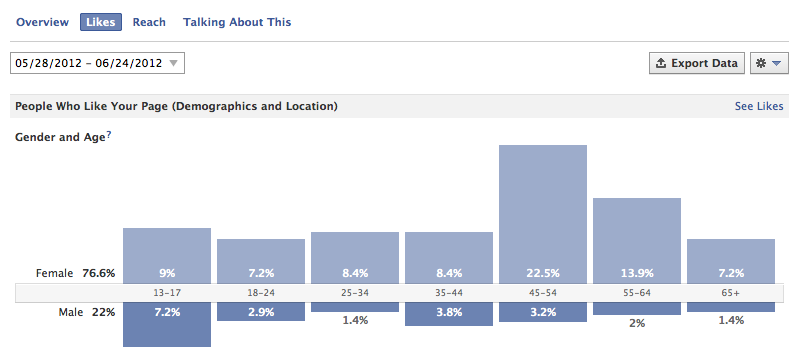
Here you get some top level demographics about the people who like your page, not individual stories or posts. But these numbers may mean nothing to you unless you are looking for the answer to a specific question or are looking at the numbers in some sort of context.
For example, let’s say you are producing content on FB that is designed to appeal to women 18-34. You might want to now how well that was working. From the chart above you can easily see that it’s not working very well; you continue to get a larger percentage of FB likes from those that are in the over 34 age ranges. Maybe you need to begin paying attention to those people as they seem more receptive to your message. Maybe you need to take a different tack to appeal to the desired age range. Or what if you saw all of a sudden a surge of likes outside the US? What might that tell you. Well if you were doing online marketing targeted at say people in the UK and then you saw a surge in UK or even European countries, you would know you are making some headway.
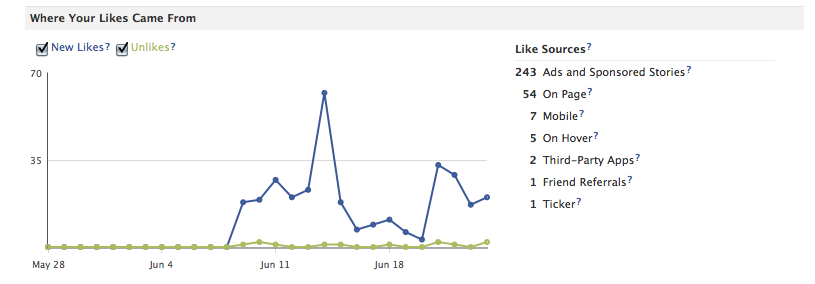
Check your like sources
You will see some of these sources:
- Admin invite (meaning you invited someone!)
- On your website (if you have a like button on your site, where the like is for you as a whole, not individual content)
- Ads and Sponsored Stories (note: this only includes people who liked your ad right in the ad, not people who clicked through to your page from the ad and then liked the page)
- On page (someone came to your actual page and clicked “Like”)
- On newsfeed (someone liked your page when they saw it in their newsfeed, perhaps because a friend shared it.)
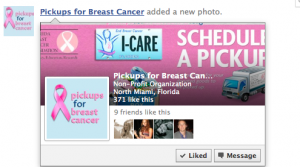
- On hover. Similar to newsfeed but the like is clicked in the hover box—see image below. Why this is is a different metric, we can not tell you at this point or why you should care. Sometimes more metrics aren’t better.
All of this should give you an idea what source is sending you the most likes. Why is this important? If you are conducting a campaign on your site to garner likes with a Like Button, it would be nice to know if that’s working or if you are doing that and running a FB ads campaign, it would be nice to know if the ads are worth paying for.
The “Reach” tab
Reach is probably the most difficult of Insight sections to fully grasp. As we mentioned in part one, reach is defined as “the number of unique people who have seen your message displayed regardless if they are a fan, friend of fan or otherwise.
This tab is all about digging deeper into who you reached and how you reached them.
Who you reached (demographics and location)
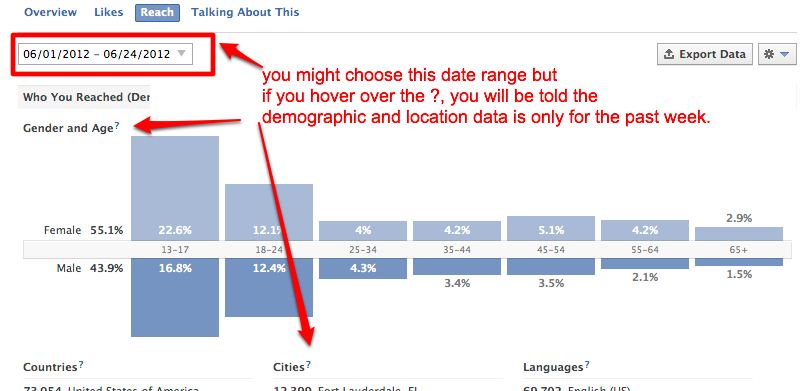
The who you reached Demographics is pretty straight forward, but note that if your roll over the question mark (?) next to Gender and Age, it is only showing you data for the last seven days of the time period you selected. FB must have a good reason for this but we’re not sure what it is.
How you Reached People
This data in this section is for the full month but even here you need to know what questions you want answered to see if the numbers tell you anything
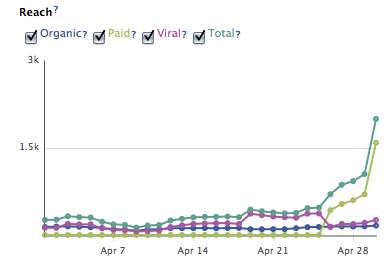
You can see in this example that Paid traffic (light green line) had a direct correlation with the huge increase in the Total reach, even though Viral reach was down. This lets you know the advertising is having an impact on your reach. Whether it has an impact on your bottom line is another story but if you are using ads to draw people’s attention to your page you want to see a spike in reach even if it’s momentarily. You would also want to see if your Likes increased for this period.
Sources of Reach
Organic: the number of unique people who saw your content in their newsfeed, on your page, or in the ticker, whether they have liked your or not
Paid: the number of unique people who saw an ad that pointed to your page. They may or may not have liked you
Viral: the number of unique people who saw a story about this page published by their friend. “Stories” include: liking your page, (meaning someone liked your page and then their friends saw that), posting to your pages wall/timeline (if you allow it), liking, commenting or sharing one of your posts and the miscellaneous bucket of taking any other action that their friends could see such as checkins, mentioning your page, responding to an event, etc.
Visits to your Page
In the last section of the Reach tab, you can see what days brought the most visits to your page as well as what “Tabs” got the most views. (Tabs are like inner pages to your overall Facebook page). Additionally you can see where some visits are coming from outside of FB. So if you are running a campaign on your own site to drive traffic to Facebook, you would see how well that was doing here.
The “How People are Talking About your Page” tab
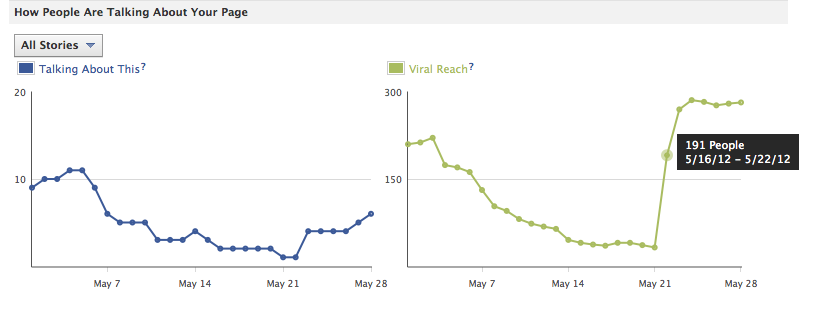
This graph really shows you the multiplying impact of FB. It shows us that even though a ton of people aren’t “talking about this”, the viral reach has exploded in this period. Look at the time frame 5/16-22. Something interesting happened there. You want to ask yourself “What was posted that day and who interacted with it?,” because it had a huge impact in reach. These are the things you look for.
The “Check-ins” tab
You will only see this tab if you have your page set up for check-ins and really you should only care about this metric if you have the type of business that a) attracts a young crowd and/or b) is a place people want others to know that they are at.
I say young (meaning under 35) because those are the people that are likely to even think about pulling out the iPhone or Droid and boasting where they checked into.
Certainly this is a metric to check if you are offering check-in deals. If you are a doctor or lawyer, people are not as likely to want to share that they are at your office. People are funny that way.
In the end…
Facebook Insights doesn’t give you insights at all; it reports numbers. You can gain insight from the numbers they provide only if you understand your FB goals, the questions you need answered to let you now whether you are meeting those goals, and the nuances of the various metrics.
Feel a little daunted by all the numbers? Share this post with your favorite Facebook page admin or give us a call. We’d love to help you.





Sarmista Aun
December 5, 2012 at 1:51 am
Hi Lisa,
I appreciate your post as it is really informative.
Nell E. Bentley
January 31, 2013 at 9:57 pm
This means that from 6/10 – 8/27, it took about 14 people “talking about” your content to reach 100 of their friends. From 8/28 – 9/9, it took nearly 88 people “talking about” your content to reach 100 friends (or nearly a 1:1 ratio).